
These days, users’ expectations for internal web-based systems are similar to their expectations for external websites – users who are used to going to their favorite shopping site in their web browser will often expect their own company’s internal systems to load just as quickly. They may not think about the fact that internal systems can have fewer hardware resources available and cannot scale up as quickly. For this reason, it is all the more important that we optimize system performance before rolling out a system and that we continually monitor it afterwards.
Many areas to optimize
Nuxeo has a lot of moving parts-the front-end, the database, Elastic Search, caching, and so on-and the exact setup can be unique to each company that uses it. And, because developers typically introduce custom functionality that is specific to the company’s needs, such as custom views, we need to make sure that we are aware of the impact of these customizations on page-load speed and that we optimize the page load process where necessary.
In short, there are many places where we can optimize performance. This blog entry won’t try to cover all of them but will instead look at one specific example scenario where we discovered some issues using the Network Monitor tool in Chrome and investigated to find the issue and the solution.
A specific example
Because Nuxeo is a single-page web application, we expect longer load times for the first load (for example, when the user first logs in, or when they are doing a hard refresh). However, in this instance, with one client’s Nuxeo installation, we were seeing longer-than-expected load times after the first load, when users were clicking between assets or other screens within the system. This was occurring in Test, Stage, and Prod. In looking at the Network Monitor tool, we were consistently seeing a gap of several seconds between the first request and the second request, and we decided to zero in on this gap to see what was happening and how we could reduce the impact.
We switched to the Performance tool in Chrome devtools, started recording, tried loading an Asset (Document) page, and then clicked the stop button after the page finished loading. This analysis showed that most of the time was consumed by scripting.
We then switched to the Call Tree tab within the Performance tool, and found that most of this time was consumed by the “set” function, which is defined in class PropertyEffects in nuxeo-app.html.
We temporarily added some code to this function to console-log data about any time this function took longer than 50 milliseconds.
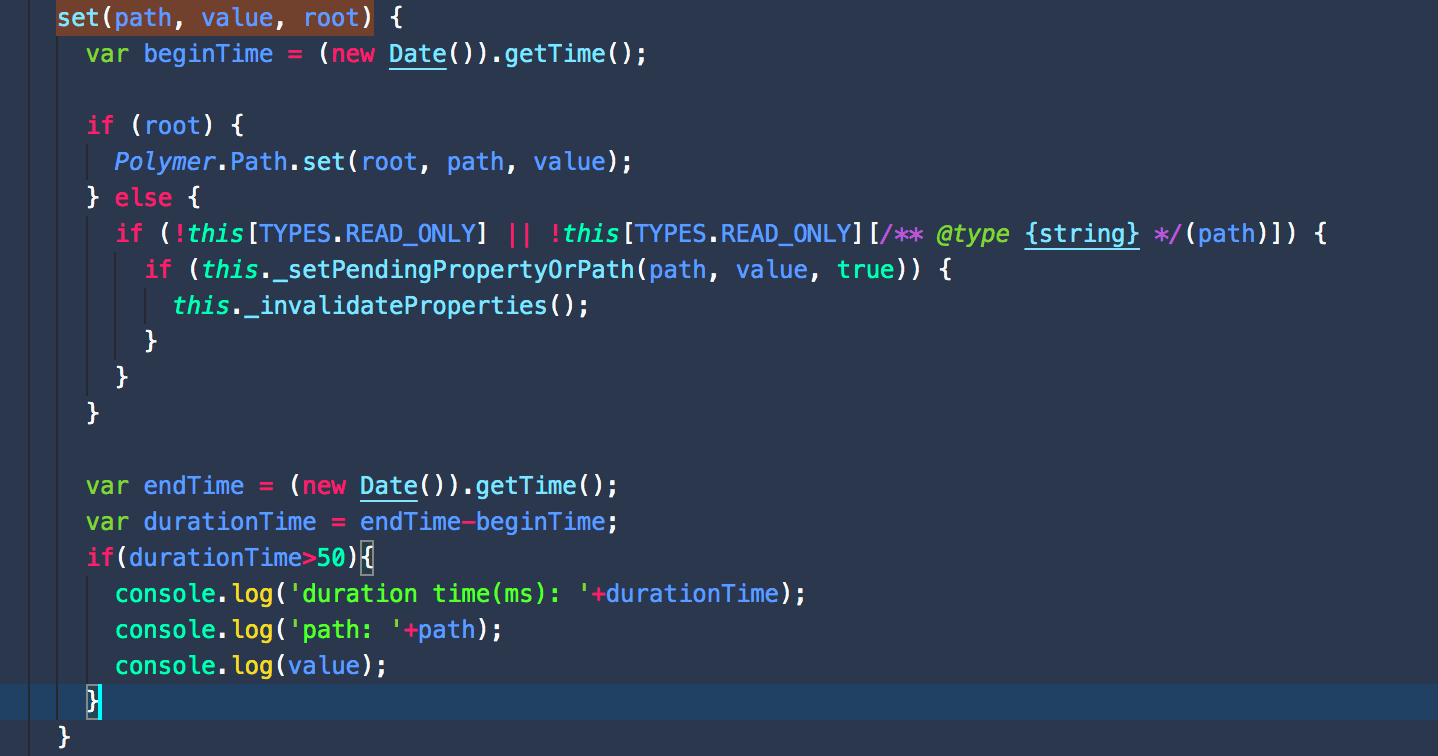
set(path, value, root) {
var beginTime = (new Date()).getTime();
if (root) {
Polymer.Path.set(root, path, value);
}
else {
if (!this[TYPES.READ_ONLY] || !this[TYPES.READ_ONLY][/** @type {string} */(path)]) {
if (this._setPendingPropertyOrPath(path, value, true)) {
this._invalidateProperties();
}
}
}
var endTime = (new Date()).getTime();
var durationTime = endTime – beginTime;
if (durationTime > 50) {
console.log(‘duration time(ms): ‘ + durationTime);
console.log(‘path: ‘ + path);
console.log(value);
}
}
We reloaded the Asset page, and found three paths, including “currentDocument” that were taking a long time to load.
We then added some breakpoints to the function to debug it. From the call stack, we could then see which function set the values to call for these resources. For “currentDocument”, we could see that it is called by the Load function in nuxeo-app.html. This function sets the current document when getting document data from the Nuxeo repository. We could then see that the other two calls were triggered by the “currentDocument” itself.
We dug in further to understand these two calls and realized that these were custom-developed resources that were being loaded during each Asset page load even though they would not be visible to the user unless the user clicked to see them. One was a form that displays when the user clicks an Edit button. The other was a custom tab with additional information about the relationships of the current asset to other assets.
A simple solution
In this case, the solution was simply to not load these additional resources until the user needs them-when they click the relevant tab or button. This reduced the load time by two seconds.
In fact, with regard to the document tabs in WebUI, Nuxeo’s documentation itself calls this out as something to check in order to improve performance. (See https://doc.nuxeo.com/nxdoc/web-ui-performance/#document-tabs)
Continuous monitoring, continuous improvement
Performance monitoring and testing is something that should occur throughout the development process and there should be ongoing monitoring throughout the life of the system. As we can see from the experience outlined in this article, it’s not just about monitoring infrastructure and system resources, but also about ensuring that we are selective about what data loads and when it loads.
Want more information?
If you would like to learn more information, please contact us today.