Background: iSoftStone identifies accessibility and usability concerns
iSoftStone’s senior accessibility designer was working with a team at a global technology company to develop user personas for a well-known business intelligence platform when she noticed something important about the platform’s color accessibility.
Its base theme, built-in report themes, and default color sequences failed WCAG Success Criterion 1.4.11 for non-text contrast.
Users with moderately low vision, low contrast vision, or color vision deficiency probably couldn’t see all the details in reports. They might not have been able to distinguish between adjacent colors within data visuals and reports. And users who wanted to create accessible reports didn’t have built-in tools to help them meet compliance standards.
Our client’s platform allows users to visualize data and then easily infuse the visuals into other apps. In short: its main purpose is to make data seen. Our client believes in and is committed to integrating accessibility, so when leaders were alerted to the color contrast issue they quickly embraced the opportunity to create a better experience for everyone.
Our solution: Accessible versions of favorite color themes
A relative color contrast of 3:1 or greater makes data visuals and report elements more distinguishable for people who don’t see a full range of colors. So, we proposed an elegant, simple solution to our client: we’d partner with them to create accessible versions for three of the platform’s best-known color themes, plus two brand–new themes designed with compliance and inclusion in mind.
The iSoftStone and client teams identified three criteria for success. Each of the new accessible color themes should:
- Have at least a 3:1 contrast ratio by default.
- Be intuitive to use, something a report author could quickly select and/or use to update existing visualizations.
- Feel like the existing themes and be in keeping with the platform aesthetic and our client’s brand.
When designing the new palettes, we considered the needs of specific visual disabilities like Deuteranopia, Protanopia, Tritanopia, and Monochromacy. Our accessibility designer worked to keep the colors close to the platform’s original themes while meeting the all-important contrast ratio. Additionally, each theme was designed for color harmony, ensuring a visually pleasant experience for every user.
Finally, we created and supplied JavaScript Object Notation (JSON) files of each theme to developers for a fast implementation.
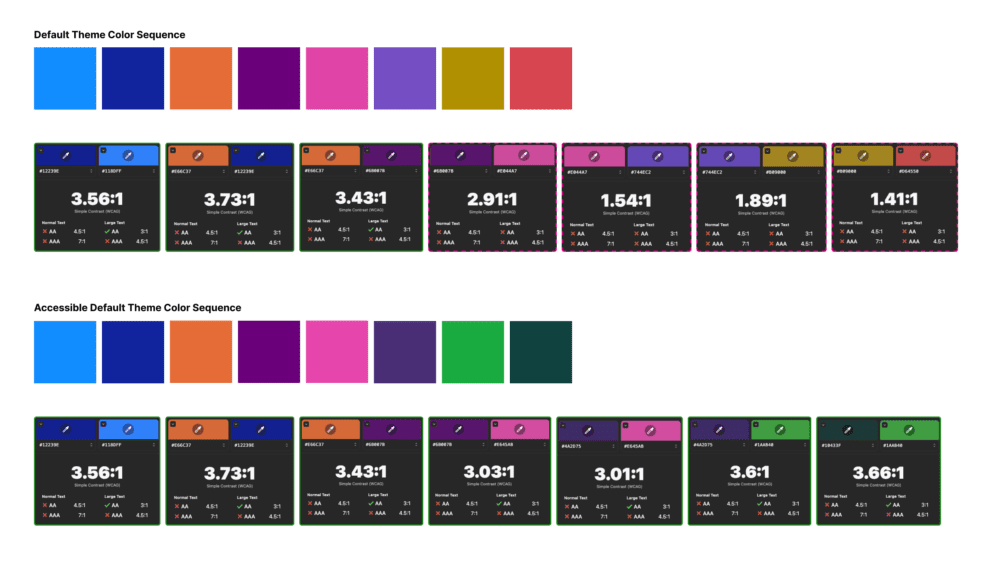 More than 50% of the platform’s default theme failed to meet a 3:1 contrast ratio. iSoftStone helped create a new accessible version in which every color meets or exceeds the ratio.
As part of our service, iSoftStone supported the launch of the accessible themes with an internal tech talk for our client’s business users. We also wrote a public blog post for the platform’s user community. Alongside an explanation of how apply the themes, our expert provided some gentle education about visual disabilities and the concept of accessibility by default.
The impact: A great experience for all users
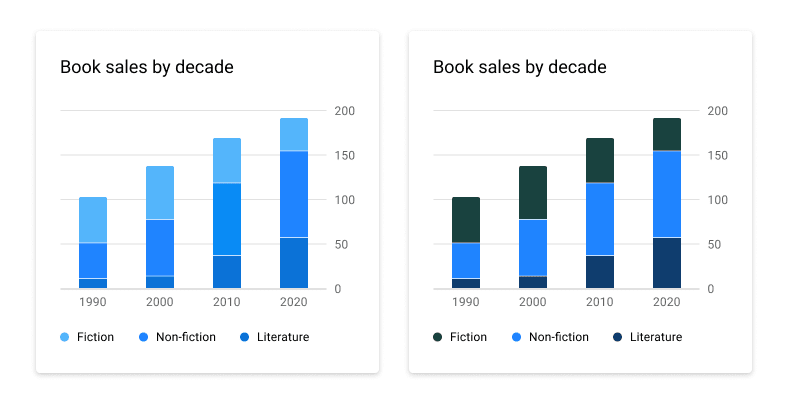
These example bar charts illustrate the difference between the platform’s default color theme (left) and the new accessible version (right).
Our client has provided a quick, simple way for users worldwide to create accessible data visuals and reports – and for people with visual disabilities to read them. Although some details like line charts will still require manual user review, it’s a game changer for the millions of people who simply couldn’t read the platform’s pie charts, graphs, and data points before.
A major success factor for the project: our client’s approach of including accessibility at the beginning of the development lifecycle. The teams identified and solved the problem swiftly because iSoftStone’s accessibility experts were already embedded. We were already helping the platform’s designers and developers consider accessibility as they worked on new features.
As John Baron, iSoftStone’s Associate Vice President of Accessibility, notes, “Having a deep subject matter expert within an organization provides clarity around good accessibility thinking. It’s an opportunity for designers and engineers to have better understanding of, directionally, what they need to be doing when developing or designing for accessibility.”